Metrics methodology
Table of Contents
Compare with ease #
You can compare metrics of Goods-to-Person (G2P) systems with ease and transparency using Instock’s metrics methodology. Metrics described here are vendor agnostic and introduce apples-to-apples comparison amongst various G2Ps including ASRS. Metrics are physical measures that can be compared independently or in conjunction with a solutions’ pricing. We aspire to open practices and suggest these simple calculations be repeated by customers evaluating automation solutions.
Total volume #
The perimeter around all of the G2P system’s hardware defines the system footprint. The system’s footprint should fit into the floor space allocated to the project and vendors are incentivized to maximize usage of both the allocated floor space and available vertical height. By multiplying the area within the system footprint by the clear height to the ceiling over it, you get the total volume consumed by a system.
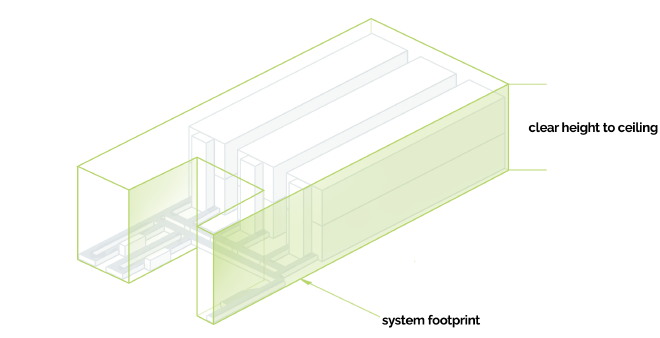

A 1,300 ft2 system footprint with 18-foot clear height to ceiling would result
If your site’s allocated floor space has an odd shape, most non-modular solutions would either not fit at all or offer low utilization of the allocated space.
Storage capacity #
A maximum number of storage containers that can be supported by a vendor within a system footprint is the system’s storage capacity. Container can be a plastic bin or a carton box, for example.
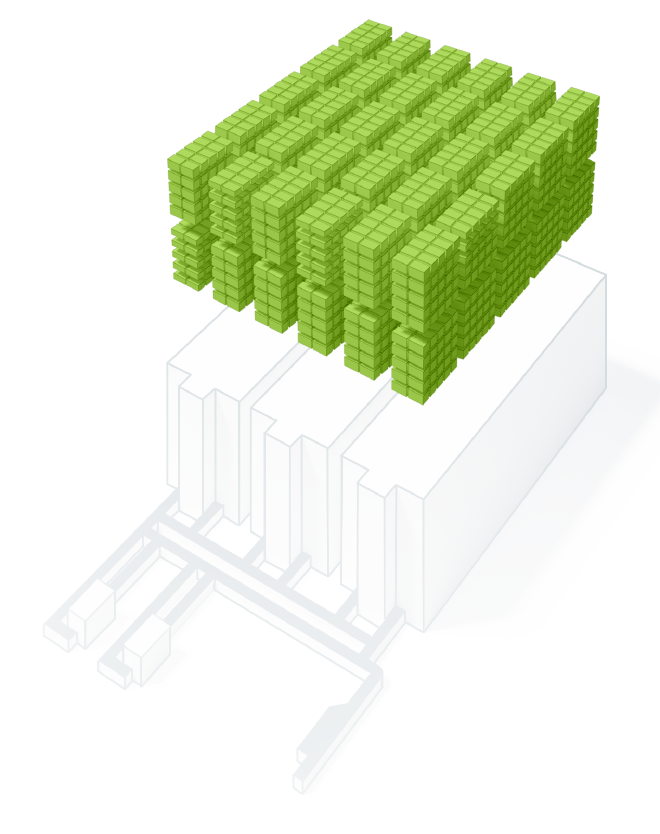
By multiplying the usable internal dimensions of a container by the total number of storage containers, you get useful volume, or storage capacity measured in ft3 (or m3).

A system uses 5,000 containers with volume
Storage density #
By dividing useful volume by total volume you get storage density of an offered G2P system. By calculating storage density for a particular system on your site, you may start relying on solid data versus abstract numbers posted by vendors in data sheets.
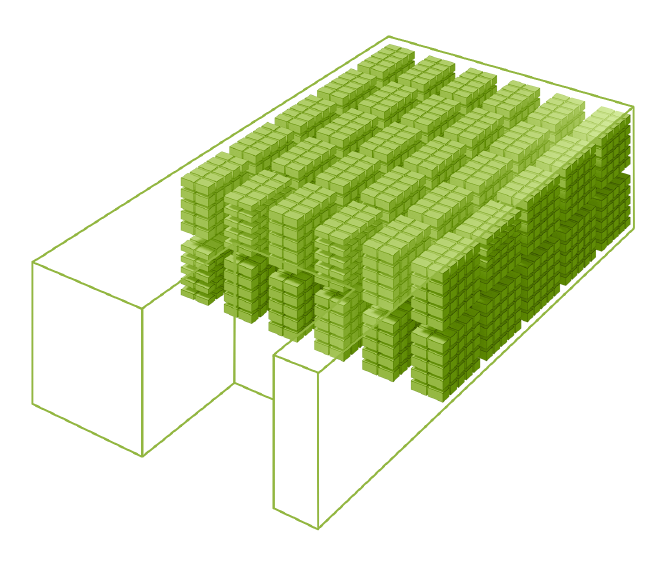

For a system with previously calculated useful volume of
If a G2P system inefficiently adapts to the shape of your room, that would be reflected in its storage density. Under fixed space allocated to automation and fixed floor space utilization (total volume is fixed), the higher the density, the better the storage capacity (useful volume).
Throughput capacity #
Industry players use many terms such as port, pick station, decanting station, to denote places where a single operator would interact with automation. At Instock we use the term workstation.
In the context of a single G2P workstation, throughput refers to the amount of goods or items that the system can support inbound or outbound within a given time period, typically measured in units per hour (UPH) or (order) lines per hour (LPH). By multiplying the throughput of a single workstation by the total number of workstations in the system, you know the throughput capacity of the system.
However, throughput should be measured under a realistic scenario of human performance and according to a machine rate. Ultimately, as a practitioner, you want to know the system throughput to understand the impact on your associate’s productivity.

For a 5 workstation system with individual throughput of 400 lines per hour, system throughput capacity will be
Among many distinctions in workstation designs, major ones would be number of parallel source channels provided by a workstation and the time for bin-change within a single channel. In a picking scenario, source channels are those presenting bins with goods to be picked, typically 1 or 2 channels per workstation. Measuring practical throughput of a single workstation is a subtle procedure that is done differently by vendors. Instock always recommends knowing the average time it takes your associate to complete one pick action and asking the vendor for the throughput capacity measured at such average time. For example, if it takes your associate 6 seconds from the moment of pick until the moment the pick is confirmed, then vendor should estimate throughput at an average of 6 seconds.
Throughput elasticity #
For many systems storage capacity and throughput capacity are coupled. Whether a vendor pursues CAPEX or some form of as-a-service (OPEX) model, at any given moment full throughput capacity will be embedded into the pricing for you as a customer. In other words, underutilizing throughput capacity on any given day would not reduce the cost to you. Therefore, you may benefit from elasticity in throughput capacity by being supported in incremental changes in capacity as your business grows, minimizing overpayments and maximizing utilization.

Day model #
There are more physical measures to an ASRS, of course. Reactivity, energy efficiency, uptime — to name a few. However, with a firm understanding of three universal ASRS metrics — storage density, throughput capacity and throughput elasticity — you can compare several systems and build a basic economic model.
Here’s an example of a model built for the business of sub-hour direct-to-consumer grocery delivery.